
USDJPY=X Technical Analysis July 22, 2025 | RSI, SMA & MACD Outlook
Key Indicators
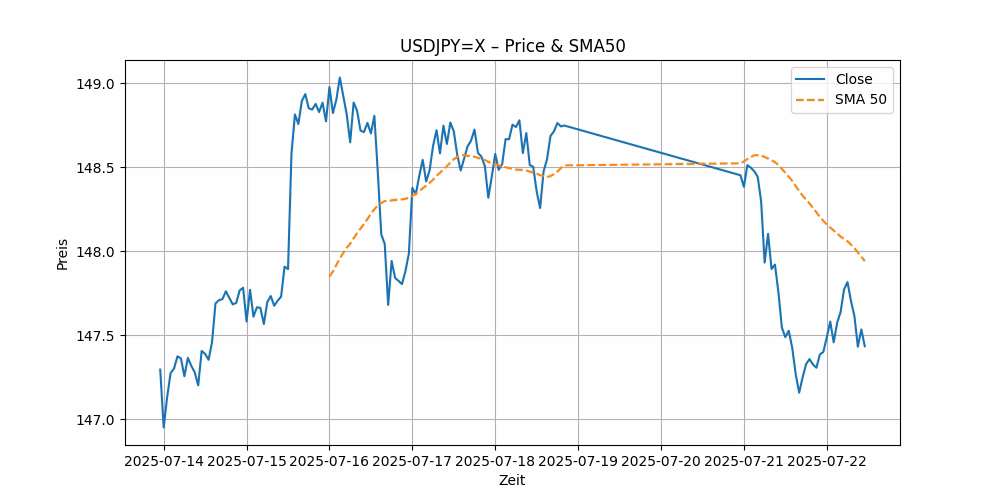
Close: 147.43499755859375 | RSI(14): 54.75 | SMA(50): 147.94 | MACD: -0.0822
Chart Overview
Market Outlook
As of July 22, 2025, the USDJPY=X, which represents the exchange rate between the U.S. dollar and the Japanese yen, closed at 147.43499755859375. This article provides an in-depth technical analysis of USDJPY=X, focusing on its price prediction and stock forecast, while also examining indicators such as the Relative Strength Index (RSI), Simple Moving Average (SMA), and the Moving Average Convergence Divergence (MACD). We will also discuss the concept of overbought conditions and their implications for traders.
Understanding Key Technical Indicators:
Before diving into the specifics of USDJPY=X, let’s clarify some technical terms used in financial analysis:
1. Relative Strength Index (RSI): This is a momentum oscillator that measures the speed and change of price movements on a scale from 0 to 100. Typically, an RSI above 70 indicates that a security is overbought (potentially overvalued and due for a price decline), while an RSI below 30 suggests it is oversold (potentially undervalued and due for a price increase). For USDJPY=X, the RSI is 54.75, which suggests that the currency pair is neither overbought nor oversold, residing in a neutral zone.
2. Simple Moving Average (SMA): This indicator calculates the average price of a security over a specific number of days, smoothing out price data by constantly updating as new prices become available. The 50-day SMA for USDJPY=X is 147.94, slightly above the closing price, indicating a mild bearish (downward) trend.
3. Moving Average Convergence Divergence (MACD): This is a trend-following momentum indicator that shows the relationship between two moving averages of a security’s price. The MACD is calculated by subtracting the 26-period Exponential Moving Average (EMA) from the 12-period EMA. The result of this calculation is the MACD line. A nine-day EMA of the MACD, called the “signal line,” is then plotted on top of the MACD line, which can function as a trigger for buy and sell signals. For USDJPY=X, the MACD is -0.0822 and the signal line is -0.1113, indicating a potential bullish crossover as the MACD line moves above the signal line.
USDJPY=X Price Prediction and Stock Forecast:
Given the current technical setup, the USDJPY=X appears to be in a transitional phase. The close proximity of the MACD and its signal line, along with a neutral RSI, suggests that the currency pair might be preparing for a directional movement, but the direction is not distinctly clear from these indicators alone.
The slight bearish bias suggested by the SMA could indicate that there might be some downward pressure on the USDJPY=X. However, the bullish crossover potential in the MACD could counteract this downward trend, suggesting a possible increase in the price of USDJPY=X in the near future.
Analyzing Overbought Conditions:
Overbought conditions occur when an asset is believed to be trading at a level above its true value. This is often followed by a price decline. The RSI is a key indicator used to identify overbought conditions. Since the RSI for USDJPY=X is at 54.75, it indicates that the currency pair is not in the overbought territory, thus reducing the risk of a significant downward correction due to overvaluation.
Based on the analysis of the technical indicators, the USDJPY=X stock forecast shows a mixed signal with a slight inclination towards bullish behavior in the short term, provided the bullish crossover of the MACD materializes. Investors should watch for any movements of the RSI towards the overbought or oversold zones, which could provide clearer signals for potential entry or exit points.
In conclusion, while the current indicators provide a somewhat neutral to slightly bullish outlook for USDJPY=X, traders and investors should remain vigilant and consider other market factors and news that could affect currency movements. As always, it’s advisable to use a combination of technical analysis, fundamental analysis, and market sentiment when making investment decisions in the forex market.