
BTC-USD Technical Analysis July 23, 2025 | RSI, SMA & MACD Outlook
Key Indicators
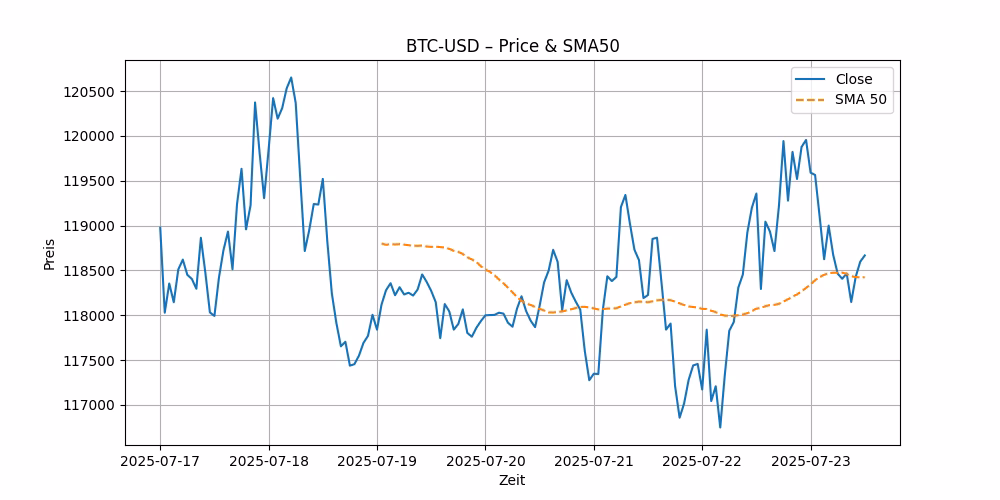
Close: 118666.7109375 | RSI(14): 31.51 | SMA(50): 118423.34 | MACD: -50.6384
Chart Overview
Market Outlook
As we delve into the BTC-USD market dynamics on July 23, 2025, it’s crucial to understand the various technical indicators and their implications on the price movement of Bitcoin against the US Dollar. This analysis will provide a detailed look at the BTC-USD price prediction and forecast, focusing on key metrics such as the Relative Strength Index (RSI), Simple Moving Average (SMA), and the Moving Average Convergence Divergence (MACD). We will also discuss the concept of overbought conditions and what they mean for investors.
On July 23, 2025, Bitcoin closed at $118,666.71, showing a slight variance against the 50-day SMA of $118,423.34. This proximity to the SMA suggests a stabilization in price after recent volatility, indicating a potential consolidation phase in the market. The closing price slightly above the SMA could hint at a bullish sentiment, albeit cautious, among investors.
The Relative Strength Index (RSI) is a momentum oscillator used to measure the speed and change of price movements. An RSI value ranges from 0 to 100, with readings below 30 typically indicating an oversold condition, and those above 70 suggesting an overbought scenario. On this day, the RSI for BTC-USD stands at 31.51. This value is just above the oversold threshold, suggesting that the selling pressure might be easing up, and a potential reversal in price could be on the horizon if other factors align. This is crucial for investors looking for entry points in anticipation of a bullish reversal.
The Moving Average Convergence Divergence (MACD) is another momentum indicator that shows the relationship between two moving averages of a security’s price. The MACD is calculated by subtracting the 26-period Exponential Moving Average (EMA) from the 12-period EMA. The result of this calculation is the MACD line. A signal line, which is the 9-day EMA of the MACD, acts as a trigger for buy and sell signals.
For BTC-USD, the MACD stands at -50.6384, with a signal line at 58.3696. The negative MACD indicates that the shorter-term average is below the longer-term average, suggesting bearish momentum. However, the significant difference between the MACD and the signal line may also hint at an upcoming positive crossover if the price starts to ascend, which could be a bullish signal for traders.
The Simple Moving Average (SMA) is a straightforward tool used by traders to gauge the average price of a security over a specific period. Here, the 50-day SMA of $118,423.34 acts as a benchmark for the market’s average sentiment over the past 50 days. The close proximity of the current price to the SMA indicates that BTC is trading near its average levels, which could be interpreted as a lack of strong directional momentum in the market.
The term “overbought” refers to a situation where the price of an asset is believed to be higher than its true value, often due to recent buying trends exceeding normal levels. This can lead to a price correction. In the current scenario, although the RSI is not signaling an overbought condition, it’s essential for investors to monitor this alongside other indicators to avoid potential pitfalls in their trading strategies.
Considering the technical indicators and market behavior, the forecast for BTC-USD could lean towards a cautious bullish outlook in the short term, provided the RSI continues to rise and the MACD approaches a bullish crossover with the signal line. However, investors should remain vigilant, as the proximity of the price to the SMA suggests that significant bullish or bearish movements could be limited without additional market catalysts.
In summary, the BTC-USD pair shows signs of potential recovery from recent lows, as indicated by the RSI slightly above the oversold zone and the MACD nearing a bullish crossover. The near alignment with the SMA suggests a period of consolidation may be underway. Investors should keep an eye on these indicators for signs of a definitive market direction in the coming days. As always, it is advisable to complement this analysis with other market factors and news that could impact the cryptocurrency space.