
Buy or Sell? BTC-USD Technical Analysis July 27, 2025 | RSI, SMA & MACD Outlook
Key Indicators
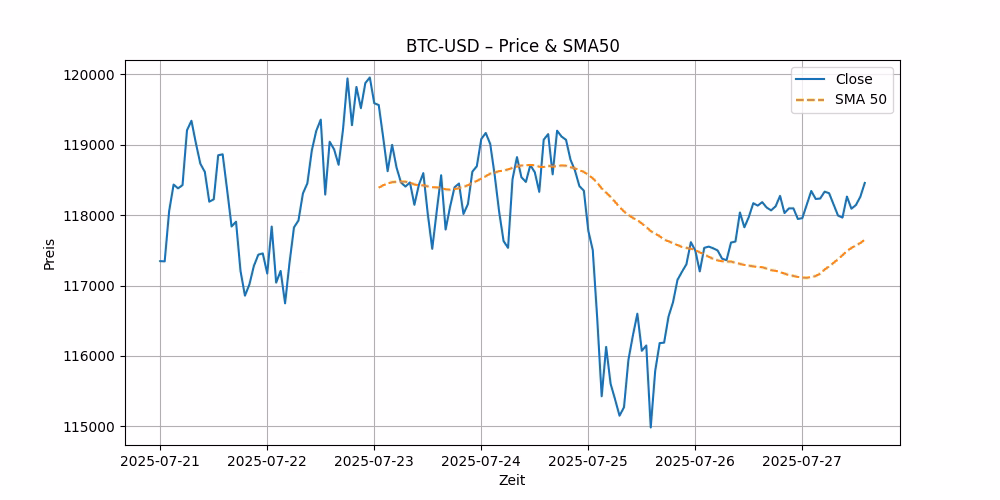
Close: 118458.09375 | RSI(14): 63.81 | SMA(50): 117651.74 | MACD: 132.9637
Chart Overview
Market Outlook
Bitcoin (BTC), the pioneering cryptocurrency, has always been a subject of intrigue and speculation in the financial markets. As of July 27, 2025, the BTC-USD pair closed at an impressive $118,458.09375. This analysis delves into the current technical indicators to provide a comprehensive BTC-USD price prediction and stock forecast, helping investors understand potential future movements.
The closing price of BTC-USD on July 27, 2025, marks a significant point of interest for both short-term traders and long-term investors. This price level not only reflects the current market sentiment but also sets the stage for upcoming trends. To gauge the future trajectory of BTC-USD, we analyze several key technical indicators: the Relative Strength Index (RSI), the Simple Moving Average (SMA), and the Moving Average Convergence Divergence (MACD).
1. Relative Strength Index (RSI): The RSI is a momentum oscillator that measures the speed and change of price movements on a scale of zero to 100. Typically, an RSI above 70 indicates that an asset is overbought (possibly overvalued and due for a price correction), while an RSI below 30 suggests that it is oversold (potentially undervalued and could rise). As of July 27, 2025, the RSI for BTC-USD stands at 63.81. This indicates that while Bitcoin is approaching overbought conditions, it hasn’t reached the threshold yet, suggesting that there might still be room for upward movement before any significant pullback.
2. Simple Moving Average (SMA): The SMA is a calculation that takes the arithmetic mean of a given set of prices over a specific number of days in the past, and it is used to smooth out price data to identify the trend direction. The 50-day SMA for BTC-USD is currently at 117,651.74. Since the closing price is above the 50-day SMA, it signals a bullish trend, indicating that the market sentiment is positive and could potentially lead to higher prices.
3. Moving Average Convergence Divergence (MACD): The MACD is a trend-following momentum indicator that shows the relationship between two moving averages of a security’s price. The MACD is calculated by subtracting the 26-period Exponential Moving Average (EMA) from the 12-period EMA. The result of this calculation is the MACD line. A nine-day EMA of the MACD, called the “signal line,” is then plotted on top of the MACD line, which can function as a trigger for buy and sell signals. For BTC-USD, the MACD stands at 132.9637, and the signal line at 147.3196. The MACD line being below the signal line typically suggests a bearish signal, indicating that a downward trend might be imminent despite the overall bullish trend.
Considering the data from these technical indicators, the BTC-USD stock forecast looks cautiously optimistic. The price is currently in a bullish phase, supported by its position above the 50-day SMA. However, the MACD indicates some potential for a downward correction, given its position below the signal line.
Investors should watch for any movements in the RSI towards the overbought threshold of 70, which could signal a short-term top and a possible price correction. If the RSI continues to rise without the price correcting significantly, it might indicate sustained buying pressure and a stronger bullish sentiment.
In conclusion, while the immediate outlook for BTC-USD suggests a bullish trend, investors should remain vigilant of the MACD and RSI indicators, which hint at possible overbought conditions and a forthcoming bearish reversal. As always, while technical analysis can provide insights, external factors such as regulatory news, market sentiment, and technological advancements should also be considered in making a comprehensive investment decision.
For those looking to invest or trade, keeping an eye on these indicators and staying updated with global economic conditions will be key to navigating the volatile cryptocurrency market effectively.